
Classification metrics
In a context of a binary classification, here are the main metrics that are important to track in order to assess the performance of the model.
Confusion matrix ― The confusion matrix is used to have a more complete picture when assessing the performance of a model. It is defined as follows:
| Predicted class | |||
| + | - | ||
| Actual class | + | TP True Positives | FN False Negatives Type II error |
| - | FP False Positives Type I error | TN True Negatives | |
Main metrics ― The following metrics are commonly used to assess the performance of classification models:
| Metric | Formula | Interpretation |
| Accuracy | Overall performance of model | |
| Precision | How accurate the positive predictions are | |
| Recall Sensitivity | Coverage of actual positive sample | |
| Specificity | Coverage of actual negative sample | |
| F1 score | Hybrid metric useful for unbalanced classes |
ROC ― The receiver operating curve, also noted ROC, is the plot of TPR versus FPR by varying the threshold. These metrics are are summed up in the table below:
| Metric | Formula | Equivalent |
| True Positive Rate TPR | Recall, sensitivity | |
| False Positive Rate FPR | 1-specificity |
AUC ― The area under the receiving operating curve, also noted AUC or AUROC, is the area below the ROC as shown in the following figure:

Regression metrics
Basic metrics ― Given a regression model , the following metrics are commonly used to assess the performance of the model:
| Total sum of squares | Explained sum of squares | Residual sum of squares |
Coefficient of determination ― The coefficient of determination, often noted or , provides a measure of how well the observed outcomes are replicated by the model and is defined as follows:
Main metrics ― The following metrics are commonly used to assess the performance of regression models, by taking into account the number of variables that they take into consideration:
| Mallow's Cp | AIC | BIC | Adjusted |
where is the likelihood and is an estimate of the variance associated with each response.
Model selection
Vocabulary ― When selecting a model, we distinguish 3 different parts of the data that we have as follows:
| Training set | Validation set | Testing set |
| • Model is trained • Usually 80% of the dataset | • Model is assessed • Usually 20% of the dataset • Also called hold-out or development set | • Model gives predictions • Unseen data |
Once the model has been chosen, it is trained on the entire dataset and tested on the unseen test set. These are represented in the figure below:

Cross-validation ― Cross-validation, also noted CV, is a method that is used to select a model that does not rely too much on the initial training set. The different types are summed up in the table below:
| k-fold | Leave-p-out |
| • Training on folds and assessment on the remaining one • Generally or | • Training on observations and assessment on the remaining ones • Case is called leave-one-out |
The most commonly used method is called -fold cross-validation and splits the training data into folds to validate the model on one fold while training the model on the other folds, all of this times. The error is then averaged over the folds and is named cross-validation error.

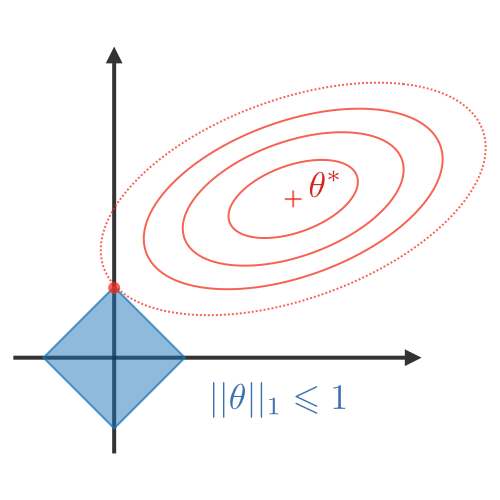
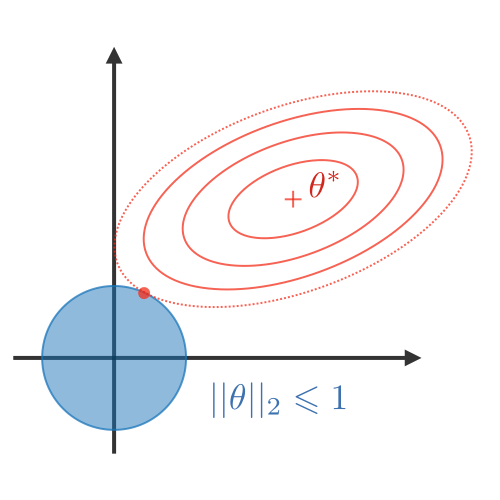
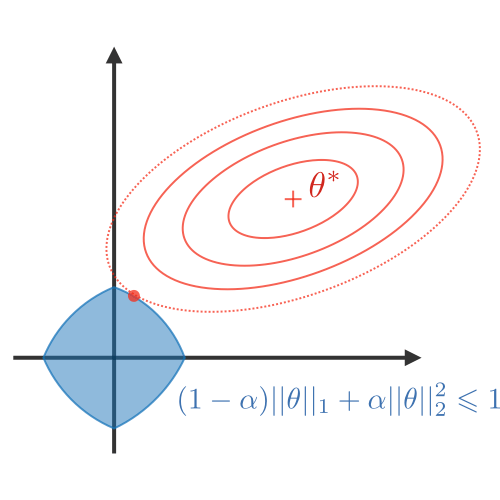
Regularization ― The regularization procedure aims at avoiding the model to overfit the data and thus deals with high variance issues. The following table sums up the different types of commonly used regularization techniques:
| LASSO | Ridge | Elastic Net |
| • Shrinks coefficients to 0 • Good for variable selection | Makes coefficients smaller | Tradeoff between variable selection and small coefficients |
 |  |  |
Diagnostics
Bias ― The bias of a model is the difference between the expected prediction and the correct model that we try to predict for given data points.
Variance ― The variance of a model is the variability of the model prediction for given data points.
Bias/variance tradeoff ― The simpler the model, the higher the bias, and the more complex the model, the higher the variance.
| Underfitting | Just right | Overfitting | |
| Symptoms | • High training error • Training error close to test error • High bias | • Training error slightly lower than test error | • Very low training error • Training error much lower than test error • High variance |
| Regression illustration | 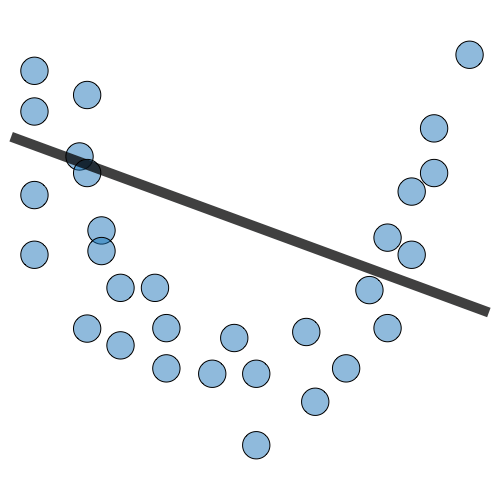 | 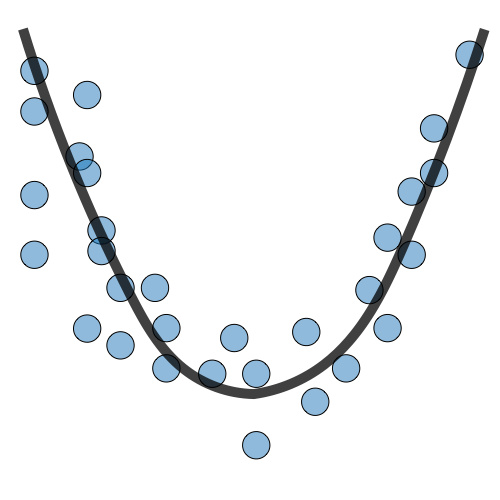 | 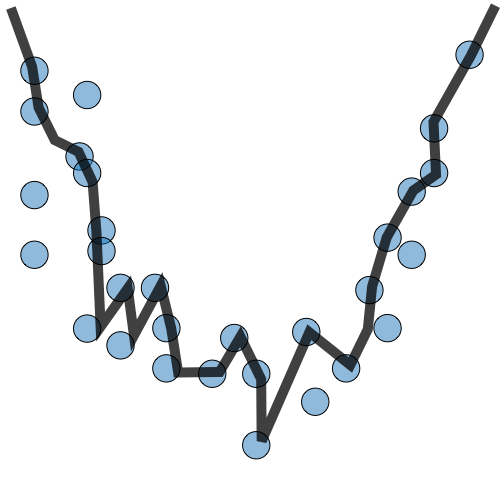 |
| Classification illustration | 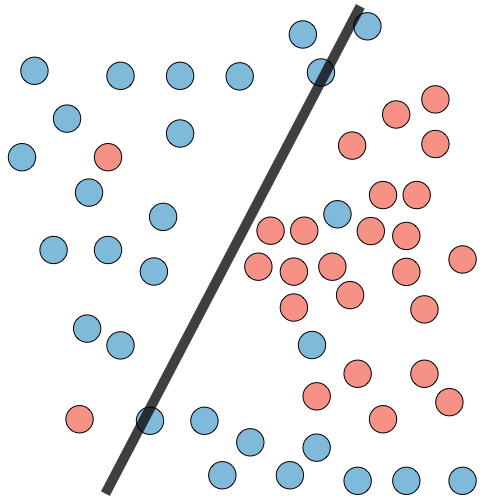 | 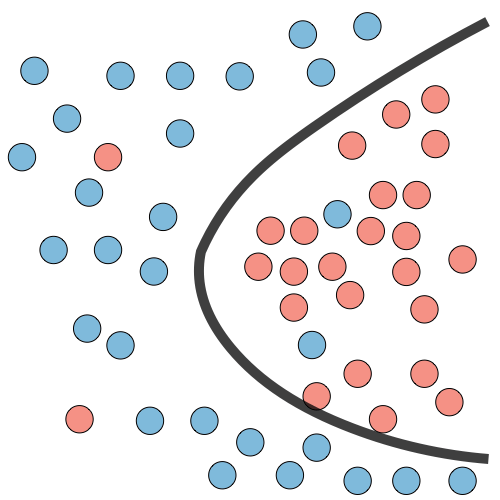 | 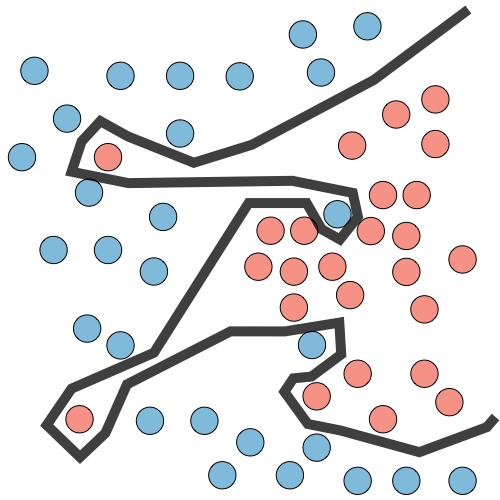 |
| Deep learning illustration | 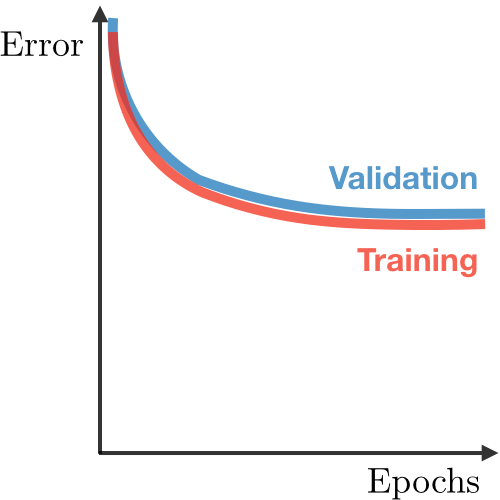 | 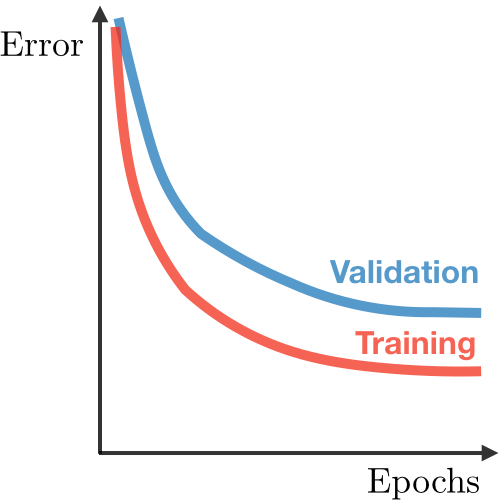 | 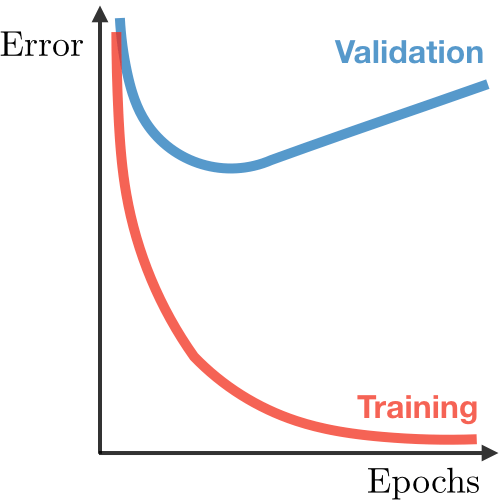 |
| Possible remedies | • Complexify model • Add more features • Train longer | • Perform regularization • Get more data |
Error analysis ― Error analysis is analyzing the root cause of the difference in performance between the current and the perfect models.
Ablative analysis ― Ablative analysis is analyzing the root cause of the difference in performance between the current and the baseline models.


0 Comments